

The Performance Reporter: Everything you Need to Know About How to Use our Campaign Reporting Tool
As you may have seen in one of our recent announcements, we have launched our newly revamped and updated Client Dashboard area for FindAMasters and FindAPhD.
One new feature that comes with this update, that we’re particularly excited about sharing with customers, is the Performance Reporter: our slick new statistics reporting tool that lets you easily analyse your campaigns across FindAMasters and FindAPhD.
In this blog, we’ll give you an introduction to it, what features are available, and how to get started using it.
What is it?
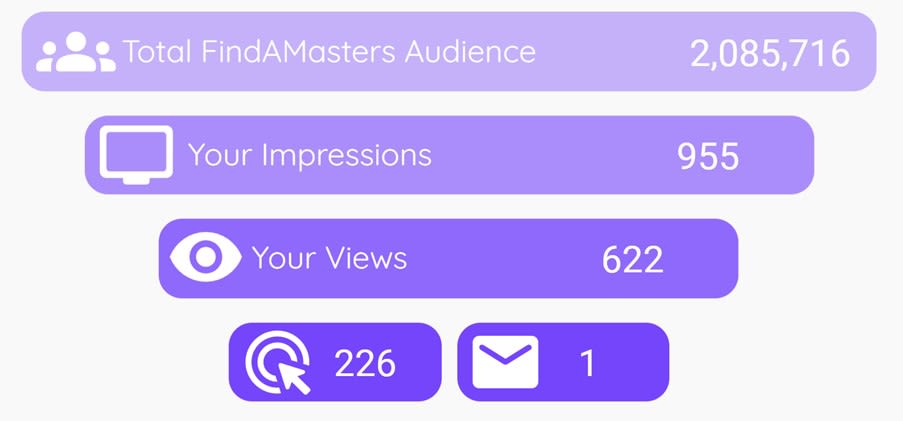
The Performance Reporter is our new, fully integrated campaign reporting tool. It allows you to review all your advertising across FindAMasters and FindAPhD, from a general overview of multiple campaigns, to looking up a specific advert’s performance in granular detail. You will see our website’s traffic for the duration selected, and then your selected campaigns’ total impressions, page views, referrals and email enquiries, all displayed in a simple funnel.
Up until now, the Performance Reporter has been our in-house statistics collecting tool that we have used to gather metrics for your campaigns. With the tool now accessible via your own dashboard, your performance data is now readily available at your fingertips, accessible whenever you need.
Below is a simple guide for how to use it, but if you do have any questions about operating the Reporter, please get in touch with your Account Manager, who will be able to help.
How to access the Performance Reporter
To access the reporter, you will first need to log into your Client Dashboard using your details. Once in, navigate to the Analytics tab on the left hand site, and select the Statistics dropdown. The Performance Reporter will load up for you.
How to use the Performance Reporter
To get started with the Performance Reporter, you will need to select the parameters you would like to return data from. In the following example, let’s say you wanted to just find out how your Programme Listings on FindAMasters had performed in the last 6 months.
Upon loading the Reporter, you would select ‘FindAMasters’ first. From here, you would then proceed to the ‘Product Type’ selector, where you then choose ‘Standard Programme’ (named to differentiate from any Featured Programmes you may have running on FindAMasters). After that, set your start and end dates for when you would like to pull the statistics from, and hey presto, your funnel report will appear!
Of course, at any of these steps listed above, you could easily tweak the selection to any other kind of filter, such as: selecting a department listed under your institution, to limit the results to just that department’s specific listings; limiting the results to just one listing, if you are interested in a single programme’s performance (if you had an on-site banner linking to it, for example); or deciding you want an institution-wide look at all of your products live on the site, so not selecting any specific products at all.
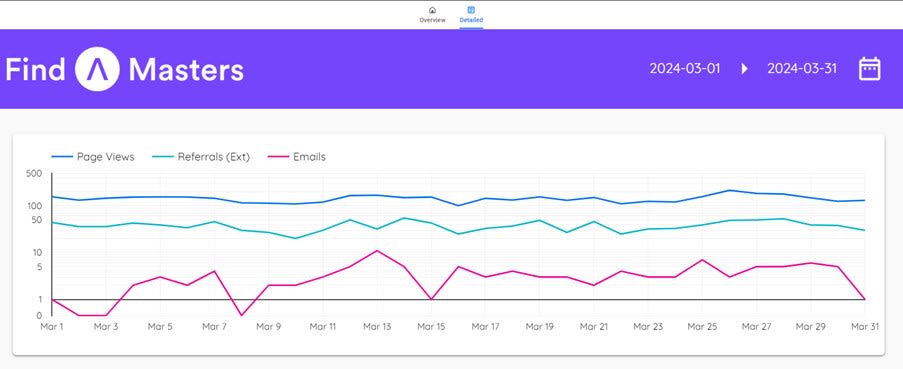
However, that’s not all. Now that you’re viewing data in what’s called the ‘funnel’ view, you can also toggle to the ‘Detailed’ tab, which will change the funnel into a line-graph. This lets you view changes in user activity over time, and gives you a breakdown of stats in a table below, which you can export in Excel. So, let’s say you had those programme listings from earlier in front of you, just swap to the ‘Detailed’ tab and you can find out which programmes were the strongest performers. Another nice feature of the line graph is you can isolate it to specific data events. So, if you were interested in just looking at Page View fluctuations over time, you can temporarily hide the other events (referrals, email enquiries) from appearing.
We hope you will enjoy playing around with the features and functions of this Reporter!
Areas to note
There are some important things to note and look out for when using the Performance Reporter.
What source is providing this data?
The data in the Performance Reporter comes directly from activity logged in GA4, which is an industry-standard events-tracking data system. We have written a couple of blogs about GA4 in the past, which we would recommend reading if you’d like a refresher on it:
How far back can I look at my campaign data?
The data in the Performance Reporter and begins from 1st January 2023. If you need anything further back than this, please get in touch with your Account Manager.
What products can I view on the Performance Reporter?
The Reporter covers all of our onsite advertising*. Other specialised campaigns that we deliver off-site (such as our Audience Extension campaigns, or Spotlight Email newsletters) will still need to be requested from your Account Manager. Here is a full list of what is included on the Performance Reporter:
FindAMasters:
- Institution and Department Profiles
- Programme Listings
- Featured Programmes
- Open Days
- Homepage Featured Institution Buttons
FindAPhD:
- Institution and Department Profiles
- Specialist Pages
- Custom Pages
- International Pages
- Research Programme Pages
- Project Listings
- Open Days
- Homepage Featured Institution Buttons
*except Targeted Display, Billboards, and Roadblocking campaigns.
My Internal Referrals seem to be a lot higher than historically?
The Internal Referral event (where a user clicks a link on our site, that takes them elsewhere on our site) has seen big increases, since our shift to GA4 and the launch of our upgraded Profiles. You can read more about it in our GA4 blog post linked above, but in summary: you can expect to see high numbers for Internal Referrals for your Profiles, due to the increase presence of internal links on our Institution and Department Profiles.
You may also like...

Life at FAU: My First Month in the Team
Our new Junior Insights Director, Jack, reflects on his first month in the role.

Where are international audiences going – and why?
What our Pulse research says about a recent shift in international study intentions.